


.svg)


One of the most impressive parts of a DoneJS application is Server Side Rendering (SSR). You can write your code once and it will render both on an SSR-enabled web server and in the browser. You’ve probably noticed, while building your DoneJS app, that it’s a generally seamless experience. However, you’ll eventually run into a situation where the code on the server doesn't execute the way you would expect. Let’s take a look at why that’s the case, then I’ll show you a neat little DoneJS utility that makes it easy to debug these situations when they appear.
The need for a debugger
With SSR, the server renders the entire page and sends it to the browser. The browser picks right up where the server left off. But the server isn’t running a full browser environment, so not everything is quite the same. SSR uses a simplified DOM. Some APIs, like WebSockets and localStorage, don’t have much utility in the context of a rendering server, so they’re not implemented. If you hard-code a dependency on an API that isn’t implemented, you might get some unintended consequences. This is where being able to debug is an absolutely necessity. But this will require a Node.js debugger.
There are quite a few debuggers available for Node.js, and I think I’ve tried most of them. Unfortunately, some of the really promising ones don’t work consistently. For some it’s due to problems getting the right C library to compile. Other Chrome-based or IDE-integrated solutions have a 45+ second delay every time the server starts. None of the available options are easy to setup, consistent, and fun to use.
Microsoft’s Visual Studio Code editor, however, has an excellent debugger that just works. It’s lightning fast and works consistently across Windows, Linux, and macOS. Best of all, it's free! But it does have one small possible caveat. For a seasoned Node.js developer, the process of setting up Visual Studio Code’s debugger is probably pretty easy. But for a new developer, or anybody not familiar with the Node.js command line API, the setup process can be an irritation and barrier to entry. The great news is that there's a DoneJS utility that solves the problem!
Introducing the donejs-vscode generator
The donejs-vscode package was created to make the debugger setup in VSCode ridiculously simple. It’s is a generator plugin for the DoneJS CLI, and to use it you run the following command in your DoneJS project’s root folder:
donejs add vscode
And just like that, you’re ready to debug your app in Visual Studio Code. The generator used the develop npm script from the package.json and created a configuration file at /.vscode/launch.json that tells VSCode how to start your app. It even starts the DoneJS server that handles hot module swapping.
The debugger is probably simple enough that you’ll be able to click around and get used to it pretty quickly. To learn all about using the debug tools in Visual Studio Code, check out the debugger documentation. You’ll want to at least learn how to start the app, use breakpoints, inspect data, and use the debug console. If you’ve used a modern browser debugger, you’ll probably be familiar with the features that are available.
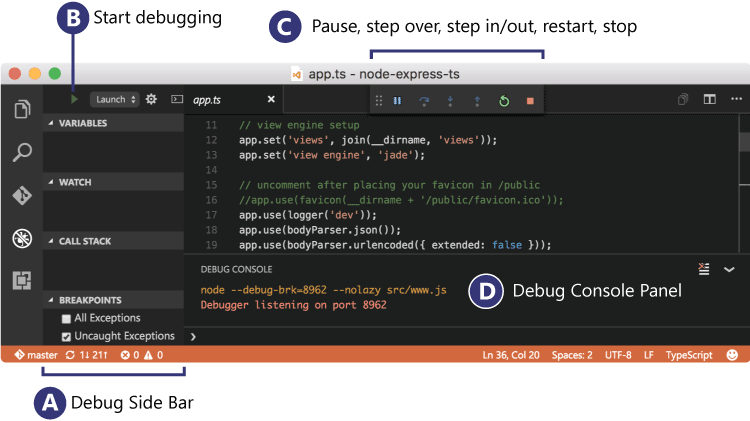
Image from the Visual Studio Code docs
Basic SSR Debugging
Now, let’s try it out in a newly-generated DoneJS app. If you need help getting one setup, learn how to create a new DoneJS app. Once you have one, open it in VSCode by using the open dialog on a Mac, or the Open Folder menu option in Linux or Windows, then select your project root folder. In the left sidebar, make sure the File Explorer icon is selected (⌘+shift+E) then open /src/app.js.
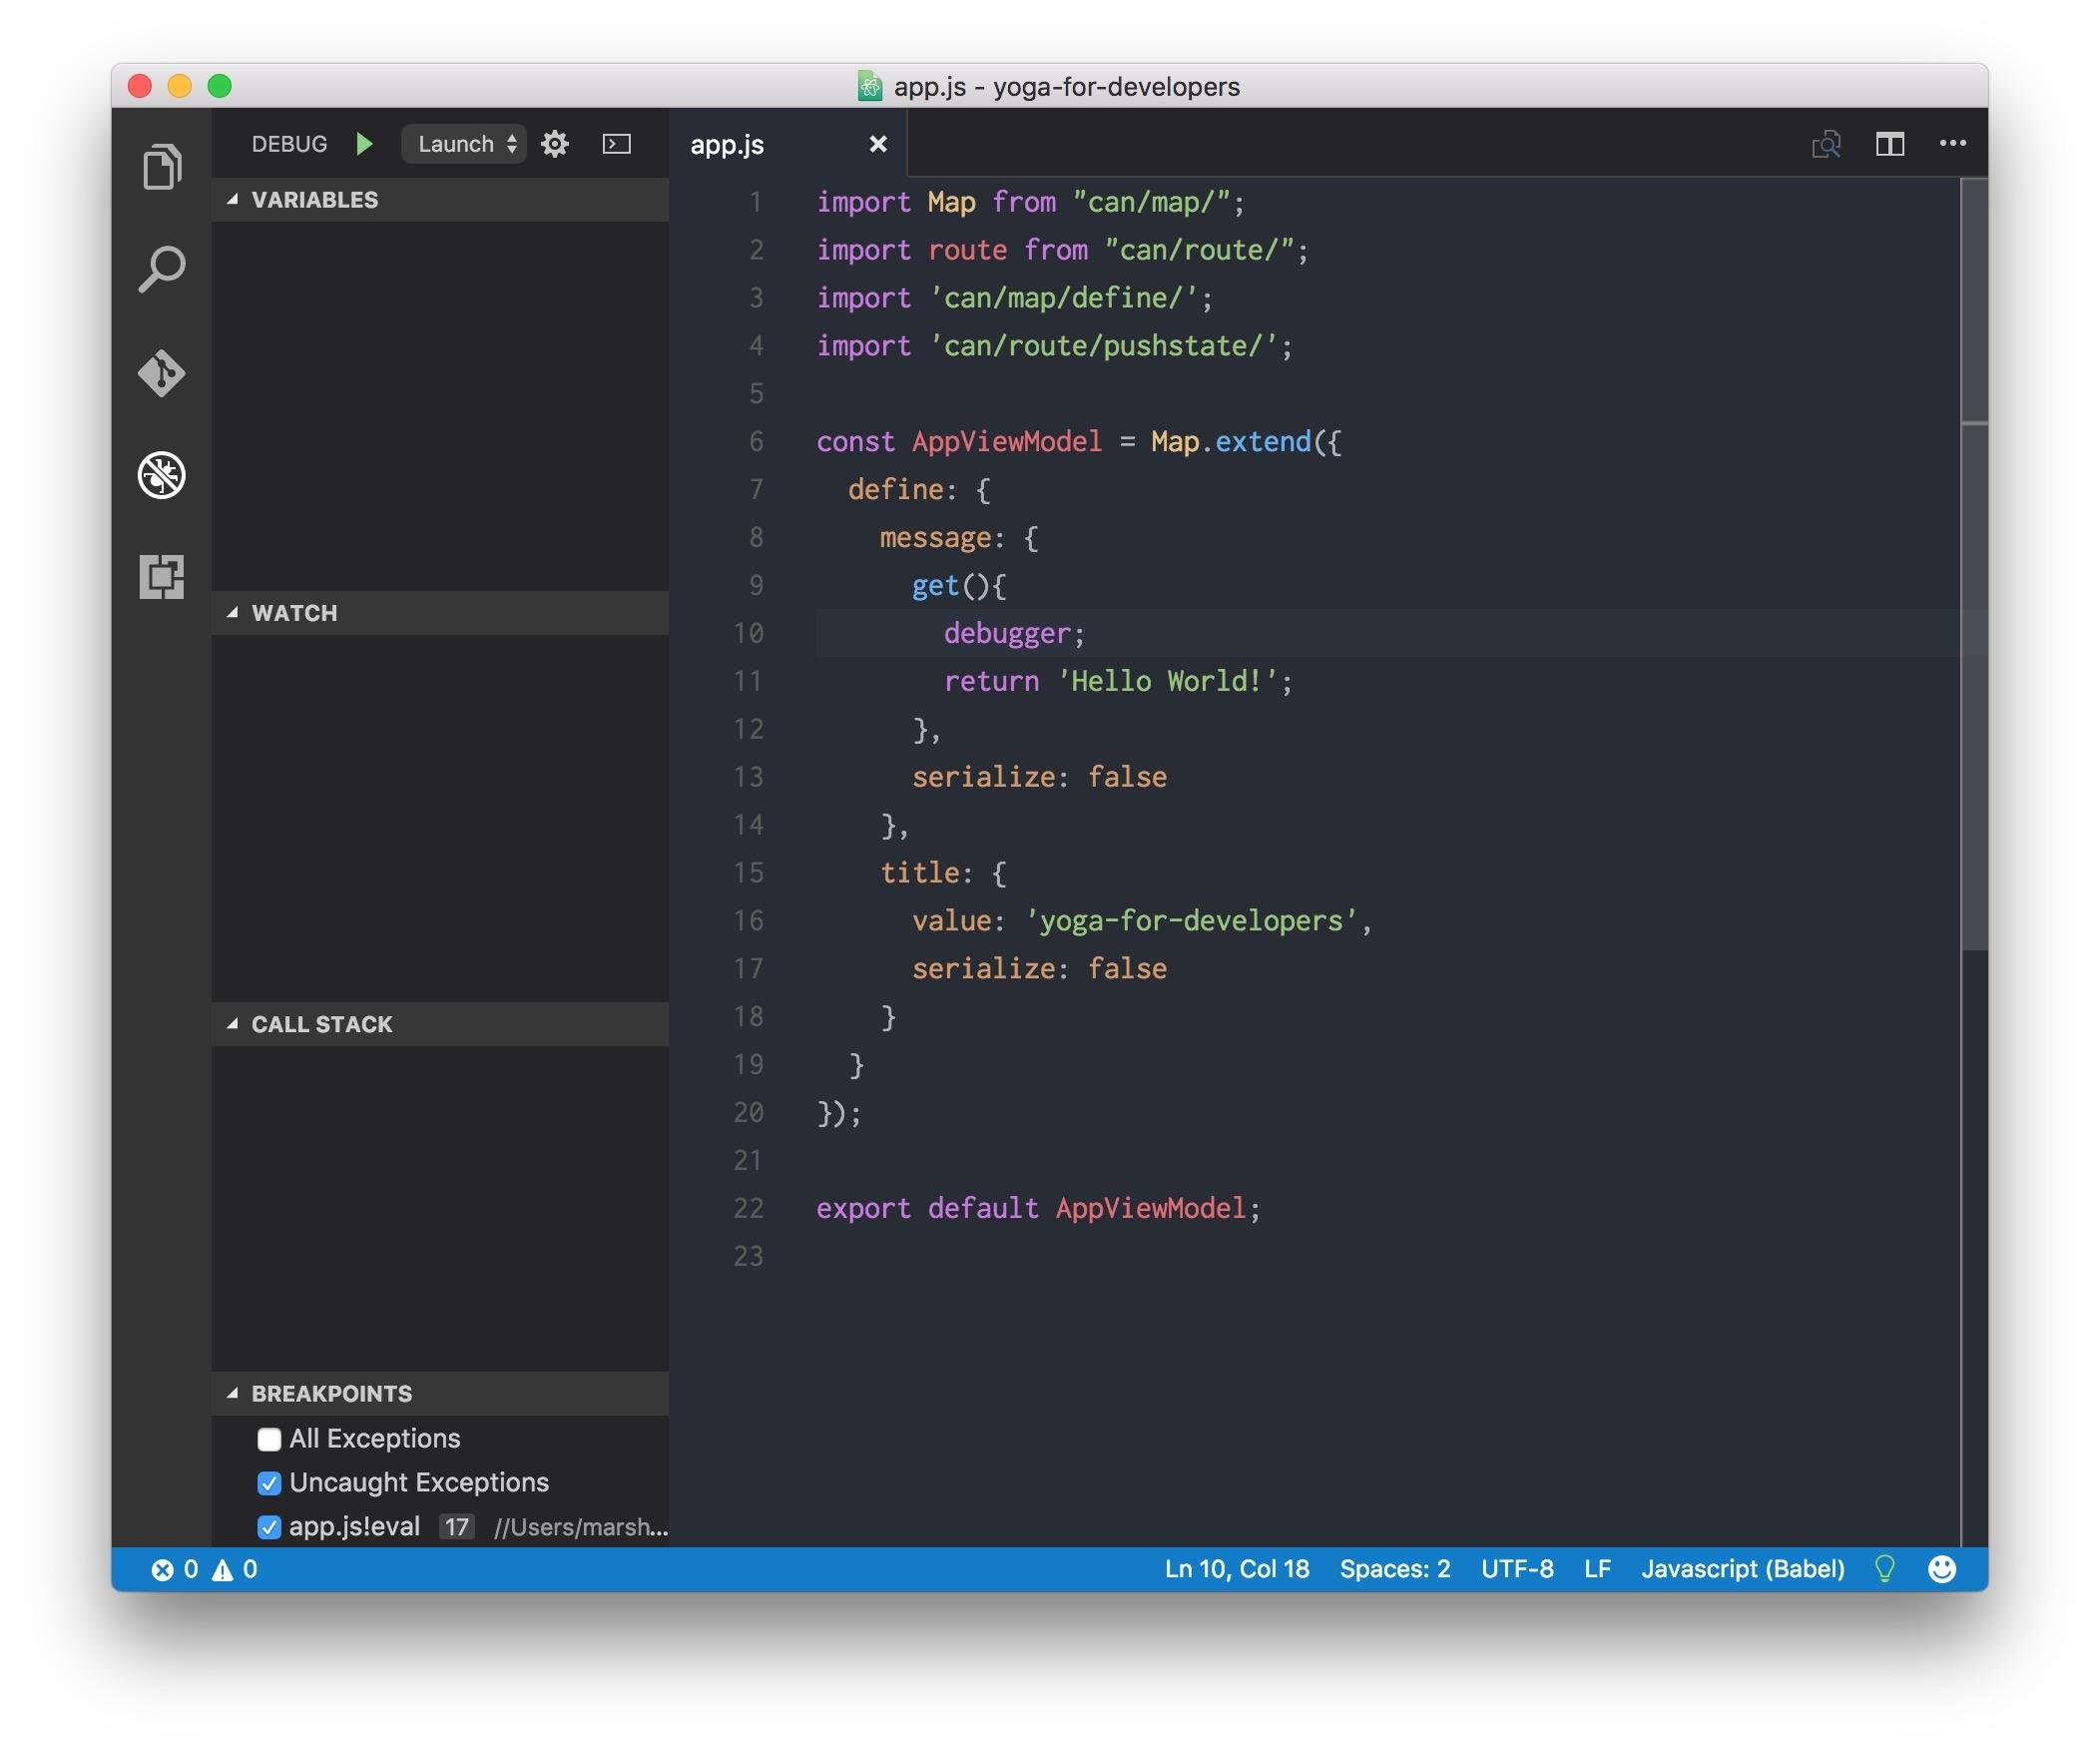
Because DoneJS applications use Steal and Babel under the hood, there’s some pre-compiling that happens on our JavaScript before it runs. This means that, for the initial breakpoint, we have to use the debugger; directive. Let’s add that, now. Locate the message attribute and change its value attribute into a get() function that returns the "Hello World!" string. Then, type debugger; on the line before the return statement. The end result should look like this:
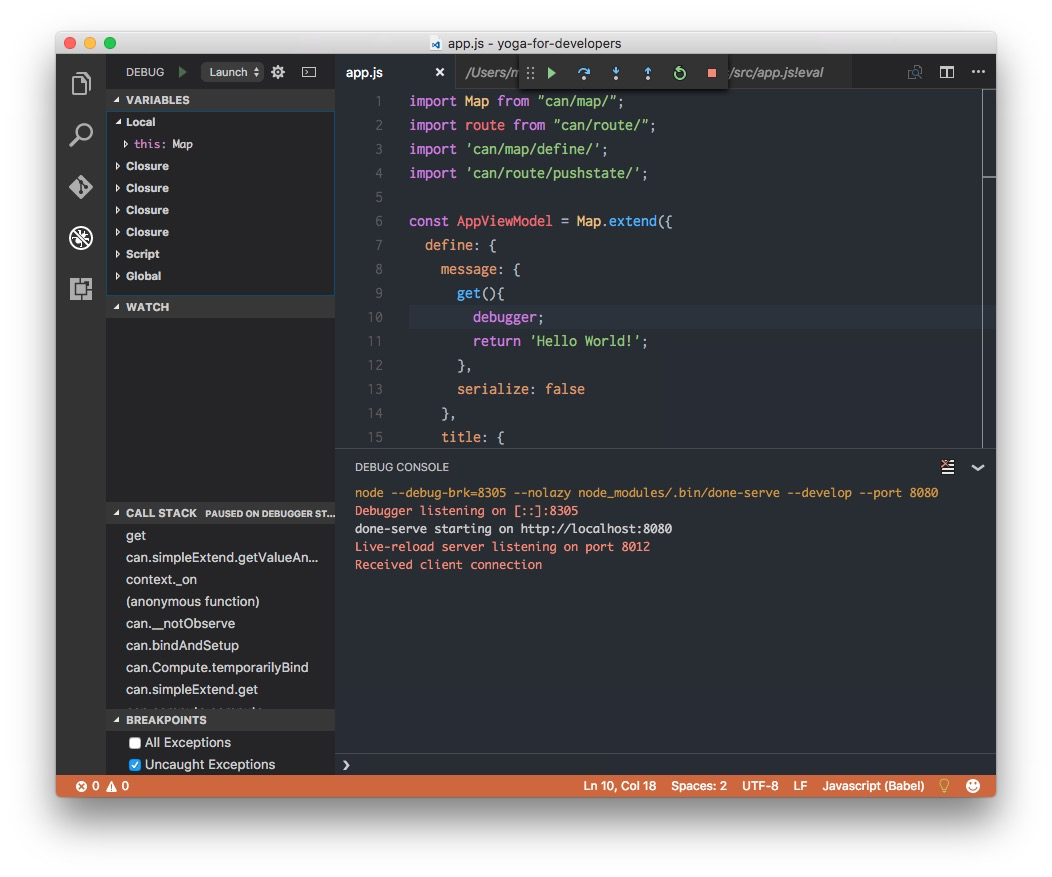
If you’ve run donejs add vscode, you’ll see a .vscode folder with a launch.json file inside, which means you’re ready to start the debugger. Open the debugger in the left sidebar (⌘+shift+D) and click the little green play button to start the server. You can also just press fn+F5 from anywhere in the app. You’ll see the debug console pop up at the bottom of the window. It should look like this:
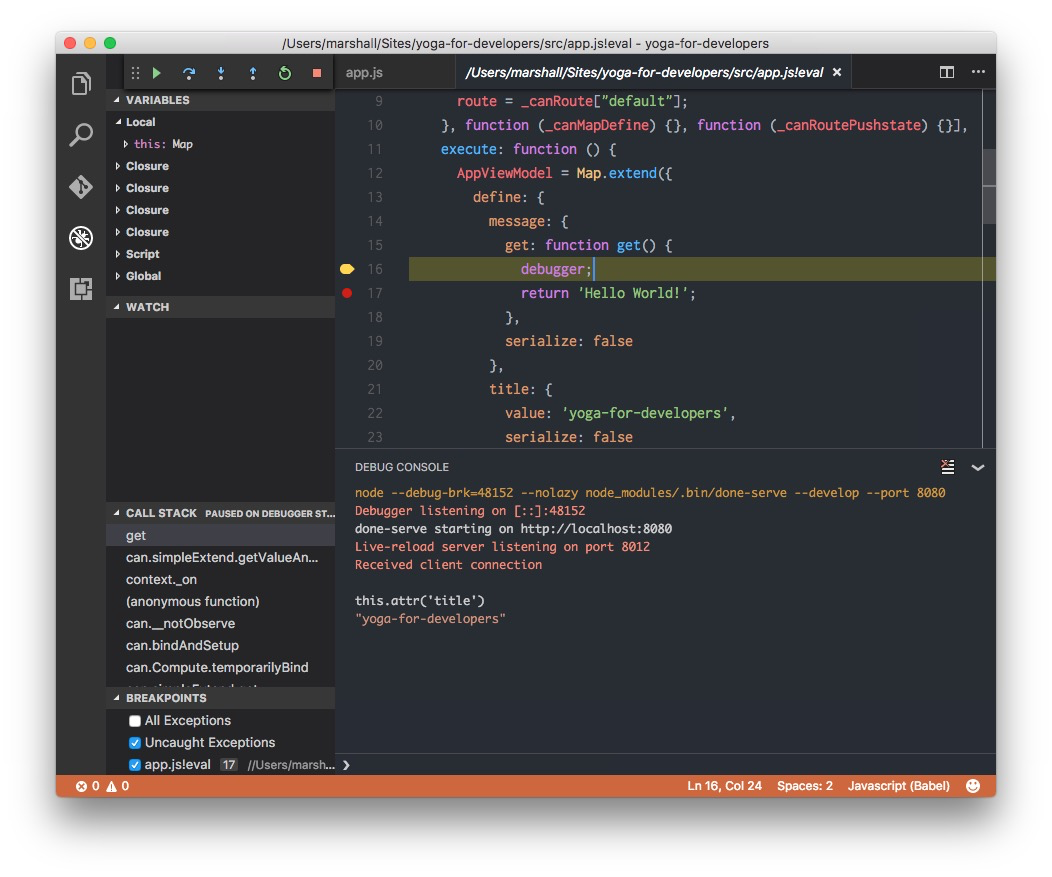
Now open http://localhost:8080 in your browser. Visual Studio Code will hit the debugger; statement, but you’ll notice that it’s in a different file. (Notice the !eval at the end of the filename) This is the compiled version of our app.js, which is what actually runs under the hood. It can’t be edited, but since the debugger; statement gets compiled, the debugger stops there.
At this point, you can set breakpoints and inspect variables from the Server Side Rendering server’s point of view. Try typing this.attr('title') into the debug console at the bottom of the window and hitting enter. You’ll see the value of the title attribute, which is defined further down in app.js.
Try a few more things in the console. window shows a fairly large object. But try window.localStorage. It’s undefined. If you had made an app where you were expecting localStorage to work, your new debugger skills just showed you why it won’t. It doesn’t exist when the application runs in Node.js.
Happy Debugging
Because a Server Side Rendering server uses a simplified DOM, the need to debug your DoneJS app is likely to someday arise. When it does, just run donejs add vscode and you’ll be up and debugging right away. Hopefully learning how to debug a server-side rendered application will save you a lot of time. It might not seem like a big deal in this small application, but will come in handy when debugging a larger component.
Finally, If you have any debugging tips to share, I’d love to know them. Get in touch on Twitter. If you find room for improvement in the donejs-vscode generator, please file an issue or come contribute on Github.