Why Performance Matters
In the 2020 economy of competing web applications and SaaS products, an application's performance can be the difference between a customer gained and a customer lost. Angular is a fantastic framework for creating scalable web applications. However, it is just as susceptible to performance issues as any other technology if the development team isn't experienced in Angular best practices, optimization, and performance consideration.
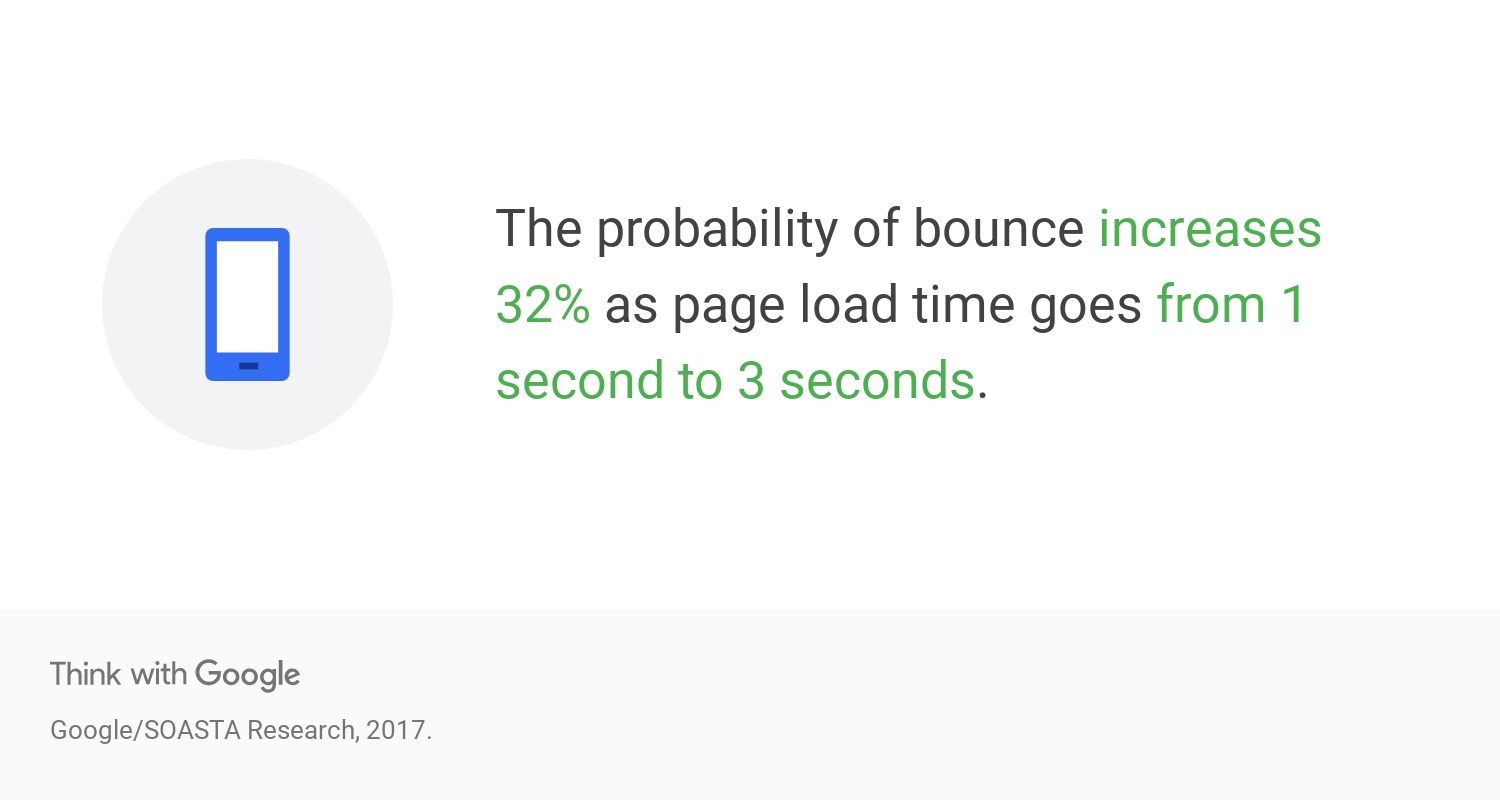
While there are many factors that impact Angular application performance, consider one common result of poor performance; page load time. The longer a web application takes to load, the more likely a user is to leave the site without taking an action that may lead to a sale.

Google doesn’t disclose its ranking algorithm or list a concrete goal for performance, so a company should ensure their application performs better than their competitors’ in order to be successful.
Conversion Impact
In Analytics-tracking-speak a user taking an action is called a conversion. For example, a conversion may be a user signing up for a newsletter to get information about your products, signing up for a free trial of your product, or making an actual purchase. All of these actions lead to sales and growing your company's revenue. Improving your Angular application's performance, can drastically increase your conversion percentage. Better performance = more $$$.
You can see the potential impact of annual revenue growth by improving your page performance using this tool : https://www.thinkwithgoogle.com/feature/testmysite/ . You'll need your average monthly visitors, conversion rate, and average order value. If you don't know how to get these values, or if you aren't currently tracking these values, you should be and we can help you with your analytics tracking!
SEO Impact
In addition to your applications’ poor performance increasing the probability that potential customers will leave your site, it will also lower your SEO score, meaning potential new customers don't even make it to your site in the first place.
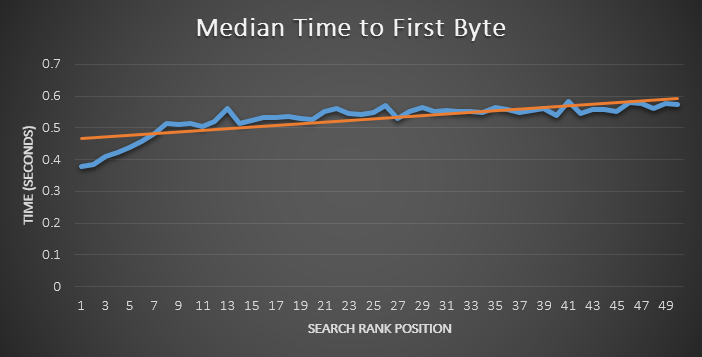
This is important to note for two reasons. When ranking pages for SEO, Google's algorithm considers your application's performance. Your content will have a reduced search result ranking if your site load time is slower not only on desktop, but 3G connections.

(source: https://moz.com/blog/improving-search-rank-by-optimizing-your-time-to-first-byte)
Second, if you’re investing time and money into SEO and ad campaigns with the intent to drive users to your application/site, the last thing you want to do is have them leave due to performance issues such as long load times or poor user experience. It negates the investments made in SEO and results in a less than optimal ROI on marketing efforts.
User Experience Impact
Providing a smooth and seamless experience where users’ interactions are met by quick app responsiveness increases user confidence in your application and company. It results in happy and engaged customers. Poor user experience does the exact opposite, and may drive your users directly to a more performant competitor.
Performance Metrics to Consider
Application performance is measured on more than just the time it takes for a page to load. There are a few key metrics you should consider when testing your application's performance and making performance improvements to your Angular codebase:
1. Large Contentful Paint
The time to render largest element visible on screen. (First Meaningful Paint used to be the important content visibility metric considered and it still used in Lighthouse < 6.0, but has been deprecated due to inconsistent results)
Good Score = < 2.5 seconds
You should care about this metric most if you're concerned with presenting engaging information to convert your user.
2. Time to Interactive
How long it takes for the page to become FULLY interactive
Good Score = < 5.2 seconds
You should care about this metric most if your users are highly interactive with your application, especially if it is a SaaS application.
3. Total Blocking Time
How long a page is blocked from responding to user input
Good score = < 300 milliseconds
You should care about this metric most if you're trying to collect information from a user like an email address for a sign up or registration.
You can see how your application is currently performing using Lighthouse by opening your application in Chrome, launching Chrome Dev Tools and navigating to the audit tab, or contact us to run this 5-minute free audit in Lighthouse for you.
How Bitovi Can Help
Bitovi helps companies improve their Angular applications' performance by following a performance checklist and implementing each checklist item based on how users interact with the application. Our consultants start by reviewing the codebase and looking for common mistakes to fix that often hinder performance, like methods being called more than necessary, Observable subscriptions not being handled properly, or recursive change detection.
Next we look at ways to refactor code to be more performant, including situationally using onPush change detection or detaching the change detection from a component entirely if necessary, removing large unused or barely used non-tree shakeable libraries, and splitting code features into modules for LazyLoading based on user patterns.
We then assess if the implementation of server side rendering tool like Scully or Angular Universal makes sense for pages with high bounce rates or poor SEO performance. Finally we use tools like perfumeJS, a small performance monitoring library, or Calibre, a robust performance monitoring app to help teams maintain performant codebases while adding new features.
Angular application performance should be considered during application development at all times. Understanding how to achieve high performance with your Angular application can be a game changer for your business, resulting in higher conversions, more effective marketing efforts, and better user experience, leading to revenue growth.


