


.svg)


StackStorm is an open source automation platform that allows you to integrate and automate workflows across your infrastructure. Monitoring StackStorm and its dependencies, such as MongoDB, RabbitMQ, and system metrics, is crucial for ensuring its availability, performance, and reliability. In this blog post, we'll explore how to monitor StackStorm using Prometheus and Grafana, along with exporters for various components, such as:
-
Blackbox Exporter for network details
-
MongoDB Exporter for database activity
-
Node Exporter for machine health
-
StatsD Exporter for StackStorm
Monitoring Connectivity and Network/DNS Issues with Blackbox Exporter
The Blackbox Exporter is a tool provided by Prometheus that allows you to probe endpoints over various protocols, such as ICMP and HTTP. It helps monitor connectivity and network/DNS issues. We can set up Blackbox Exporter to probe StackStorm instances, MongoDB, RabbitMQ, and other services.
To set up Blackbox Exporter for your instances, follow the guide Blackbox Exporter Github.
Blackbox probes
Currently, there are only two currently available probes:
-
A basic curl test (http_2xx)
-
A basic ping test (icmp)
modules:
  http_2xx:
    prober: http
    timeout: 20s
    http:
      method: GET
      preferred_ip_protocol: "ip4"
      tls_config:
        insecure_skip_verify: true
  icmp:
    prober: icmp
    timeout: 10s
    icmp:
      preferred_ip_protocol: "ip4"
      ip_protocol_fallback: true
Both of the above probes have been adapted from examples provided by Prometheus. Additional probe types can be found in the Blackbox Exporter’s GitHub Repo example file.
Once the Blackbox exporter is set up, you can use the example below to set up Prometheus targets to monitor ICMP and HTTP endpoints in prometheus.yaml.
# icmp module with ping connectivity test
- job_name: blackbox-ping
  honor_timestamps: true
  params:
    module:
    - icmp
  scrape_interval: 15s
  scrape_timeout: 10s
  metrics_path: /probe
  scheme: http
  relabel_configs:
  - source_labels: [__address__]
    separator: ;
    regex: (.*)
    target_label: __param_target
    replacement: $1
    action: replace
  - separator: ;
    regex: (.*)
    target_label: __address__
    replacement: 0.0.0.0:9115 #replace with blackbox exporter instance ip
    action: replace

# http_2xx module with http connectivity test
- job_name: blackbox-http
  honor_timestamps: true
  params:
    module:
    - http_2xx
  scrape_interval: 15s
  scrape_timeout: 10s
  metrics_path: /probe
  scheme: http
  relabel_configs:
  - source_labels: [__address__]
    separator: ;
    regex: (.*)
    target_label: __param_target
    replacement: $1
    action: replace
  - separator: ;
    regex: (.*)
    target_label: __address__
    replacement: 0.0.0.0:9115 #replace with blackbox exporter instance ip
Monitoring MongoDB with MongoDB Exporter
Monitoring MongoDB using MongoDB Exporter is essential for gaining insights into the performance and health of your MongoDB database. MongoDB Exporter is a Prometheus exporter that collects and exposes MongoDB metrics in a format compatible with Prometheus.
MongoDB Exporter is a Prometheus exporter for MongoDB metrics. It collects various MongoDB server metrics such as operations, connections, memory usage, and replication status. You can install MongoDB Exporter and configure Prometheus to scrape metrics from it. Check out the MongoDB Exporter repo in GitHub for a guide to running MongoDB in a Docker Container.
You can also set up the MongoDB exporter as a service. Below is a service example.
[Unit]
Description=MongoDB Exporter

[Service]
Type=simple
Restart=always
ExecStart=/usr/local/bin/mongodb_exporter --collect-all --no-mongodb.direct-connect
#ExecStart=/usr/local/bin/mongodb_exporter --collector.dbstats --collector.replicasetstatus --no-mongodb.direct-connect
User=prometheus

[Install]
WantedBy=multi-user.target
Save your mongodb URI at /etc/systemd/system/mongodb_exporter.service.d/override.conf
[Service]

Environment="MONGODB_URI=mongodb://<uname>:<pwd>@mongo_instance_01:27017,mongo_instance_02:27017,mongo_instance_03:27017"
and then set up your targets in a Prometheus configuration as below:
- job_name: st2rs_mongodb_exporter
  honor_timestamps: true
  scrape_interval: 2m
  scrape_timeout: 1m
  metrics_path: /metrics
  scheme: http
  static_configs:
  - targets:
    - 0.0.0.0:9215. #replace with mongodb exporter instance ip
Monitoring StackStorm Instances' System Metrics with Node Exporter
Node Exporter is a Prometheus exporter for system metrics such as CPU usage, memory usage, disk I/O, and network statistics. It provides insights into the health and performance of the underlying host where StackStorm is running. You can set up Node Exporter on each StackStorm server and configure Prometheus to collect system metrics. Follow Node Exporter Github to set up node exporter on VMs.
Below is Prometheus target configuration for node exporters:
- job_name: mongoRS_nodeexporters
  honor_timestamps: true
  scrape_interval: 15s
  scrape_timeout: 10s
  metrics_path: /metrics
  scheme: http
  static_configs:
  - targets:
    - <instance01_ip>:9100
    - <instance02_ip>:9100
A few Important StcakStorm metrics that can be monitored and visualized in Grafana:
st2_action_execution_abandoned_total
st2_action_execution_calculate_result_size_total
st2_action_execution_calculate_result_size_total_count
st2_action_execution_calculate_result_size_total_sum
st2_action_execution_canceled_total
st2_action_execution_canceling_total
st2_action_execution_delayed_total
st2_action_execution_failed_total
st2_action_execution_requested_total
st2_action_execution_running_total
st2_action_execution_scheduled_total
st2_action_execution_succeeded_total
st2_action_execution_timeout_total
st2_action_execution_update_execution_db_total
st2_action_execution_update_execution_db_total_count
st2_action_execution_update_execution_db_total_sum
st2_action_execution_update_liveaction_db_total
st2_action_execution_update_liveaction_db_total_count
Monitoring StackStorm with StatsD Exporter
StatsD Exporter allows you to collect and export custom metrics from StackStorm. It maps StackStorm metrics to Prometheus-compatible metrics using a mapping file. You can configure StackStorm to send metrics to StatsD, and then StatsD Exporter will translate those metrics into Prometheus metrics. Here is StatsD Exporter Github to set up StatsD exporter. Below is a sample configuration for StatsD Exporter's metric mappings, which you can set up in /home/prometheus/statsd_exporter/statsd_mappings.yml
StatsD mappings
mappings:
# Base system mappings
  - match: "st2.orquesta.workflow.executions"
    name: "st2_orquesta_workflow_executions_total"
    match_metric_type: counter

## Action data:
# Base Mappings
  - match: "st2.action.executions"
    name: "st2_action_executions_total"
    match_metric_type: counter

## Rule data:
# Updated name matching, ordered first to avoid backtracking
  - match: "st2.rule.*.*.processed"
    name: "${1}_rule_${2}_processed_total"
    labels:
      pack: "$1"
      action: "$2"

## Trigger data:
  - match: "st2.trigger.*.*.processed"
    name: "${1}_trigger_${2}_processed_summary"
    observer_type: summary
    labels:
      pack: "$1"
      action: "$2"
StackStorm StatsD Metrics Configuration
Ensure that StackStorm is configured to send metrics to StatsD with the appropriate prefix. Here's an example configuration in StackStorm's st2/conf/st2.conf file:
[metrics]
driver = statsd
host = <statsd_host_ip>
port = 8125
prefix = st2_prod
Prometheus targets for StatsD Metrics
With these configurations in place, you can use below Prometheus configuration to scrape metrics from StatsD Exporter and visualize them in Grafana alongside other metrics:
- job_name: st2_statsd
  honor_timestamps: true
  scrape_interval: 1m
  scrape_timeout: 10s
  metrics_path: /metrics
  scheme: http
  static_configs:
  - targets:
    - 0.0.0.0:9123 #replace with your ip and port for statsd exporter
Follow the StackStorm documentation for more on StackStorm StatsD configuration.
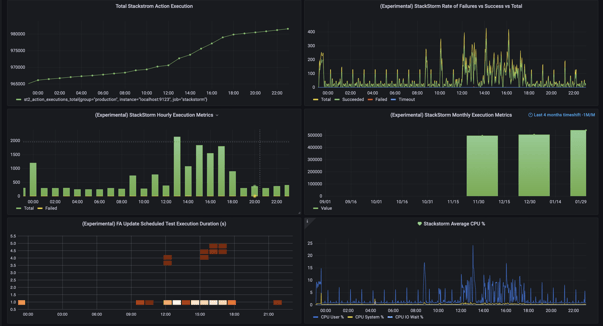
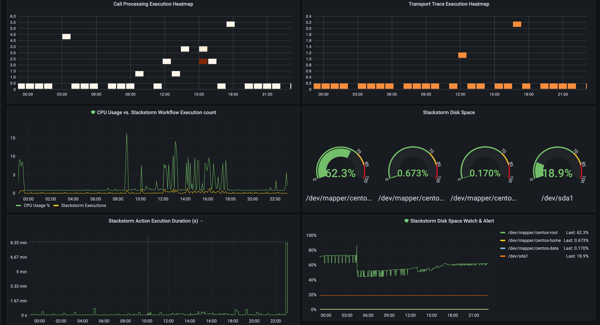
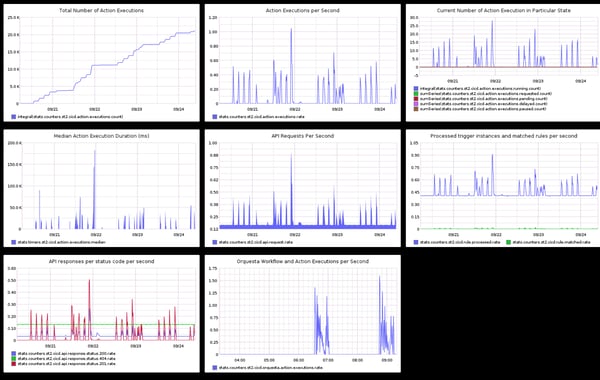
Examples of visualizations for StackStorm metrics.
Monitoring the Services
Core StackStorm services like (auth, stream, api) can be monitored via an http monitoring process via Prometheus & Grafana.
Other services are running and supporting StackStorm, for instance, the st2scheduler. However, these other services do not have exposed endpoints, so we would need to expose them in some way using a process monitoring tool. This is also better managed in an HA deployment, but the three mentioned services - api, auth and stream - cover and identify a fair number of common ST2 outage issues.
The endpoints for these services are reachable from a web browser, but you may not have proper authentication:
For StackStorm services api and stream, the success code is 401, while for auth, the success response code is 200
If you disable a specific ST2 service, e.g., by issuing the command st2ctl stop st2stream, you can check the endpoint to see whether you get different HTTP responses when the services run.
This means that even without authentication to ST2, you can paint a reasonably accurate picture of the states of those three services.
For your three services, you can see these states based on the HTTP request, depending on whether the specific service is running or not:
|
st2api |
st2auth |
st2stream |
|---|---|---|
|
401-Up |
200-Up |
401-Up |
|
503-Down |
503-Down |
200-Down |
st2stream being ‘considered’ down with a 200 HTTP response code is a particular anti-pattern but we can work with it.
Collecting the Data
We will continue to utilize the aforementioned state patterns based on the HTTP codes, despite their occasional awkwardness.
To enhance this response, we have the option to include a ST2 security token header in our blackbox-exporter configuration; or alternatively, map it in the URL as described in the ST2 documentation on Authentication. Authentication — StackStorm 3.8.0 documentation
However, implementing this approach would necessitate additional security measures to safeguard the API key, as it would need to be stored within blackbox-exporter's configuration.
As we are employing a straightforward blackbox-http request, our prometheus configuration will resemble the following:
scrape_configs:
- job_name: 'blackbox-http'
metrics_path: /probe
scrape_interval: 15s
params:
module: [http_2xx]
static_configs:
- targets: ['http://your-st2-server.net/api/v1']
labels:
alias: 'dev-st2-api'
service: 'st2-services'
environment: 'dev'
- targets: ['http://your-st2-server.net/auth/v1/sso']
labels:
alias: 'dev-st2-auth'
service: 'st2-services'
environment: 'dev'
- targets: ['http://your-st2-server.net/stream/v1/stream']
labels:
alias: 'dev-st2-stream'
service: 'st2-services'
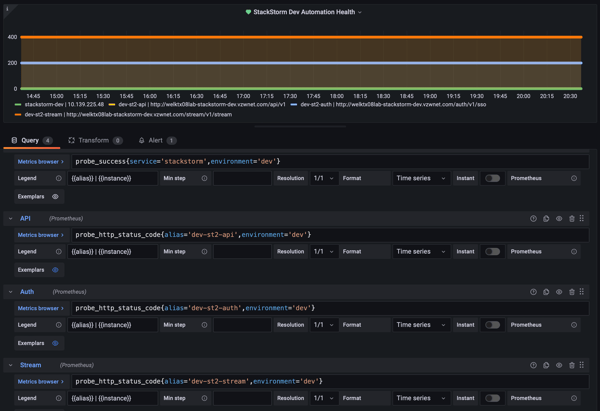
environment: 'dev'For more information on configuring and setting up blackbox-exporter and Prometheus, the documentation and examples on GitHub cover most use cases.
Here is example Grafana panel for StackStorm services:
Conclusion
Monitoring StackStorm and its dependencies is essential for ensuring the reliability and performance of your automation workflows. By leveraging Prometheus and Grafana along with exporters for different components, you can gain valuable insights into the health and behavior of your StackStorm environment. With proactive monitoring and alerting, you can quickly identify and address any issues before they impact your operations.
Need DevOps Consulting services? Bitovi has consultants that can assist with all aspects of your development and DevOps journey.
Need Help?
Drop into Bitovi’s Community Discord, and talk to us in the devops forum! Our StackStorm Consulting experts would love to help with your StackStorm environment.