Debugging and DevTools page
Learn how to set up and use both DevTools and Debugger.
Overview
In this section, you will:
- Use React DevTools.
- Use React Native’s debugger.
Objective 1: React DevTools
We will be setting up React DevTools to help us inspect the UI:
Using React DevTools
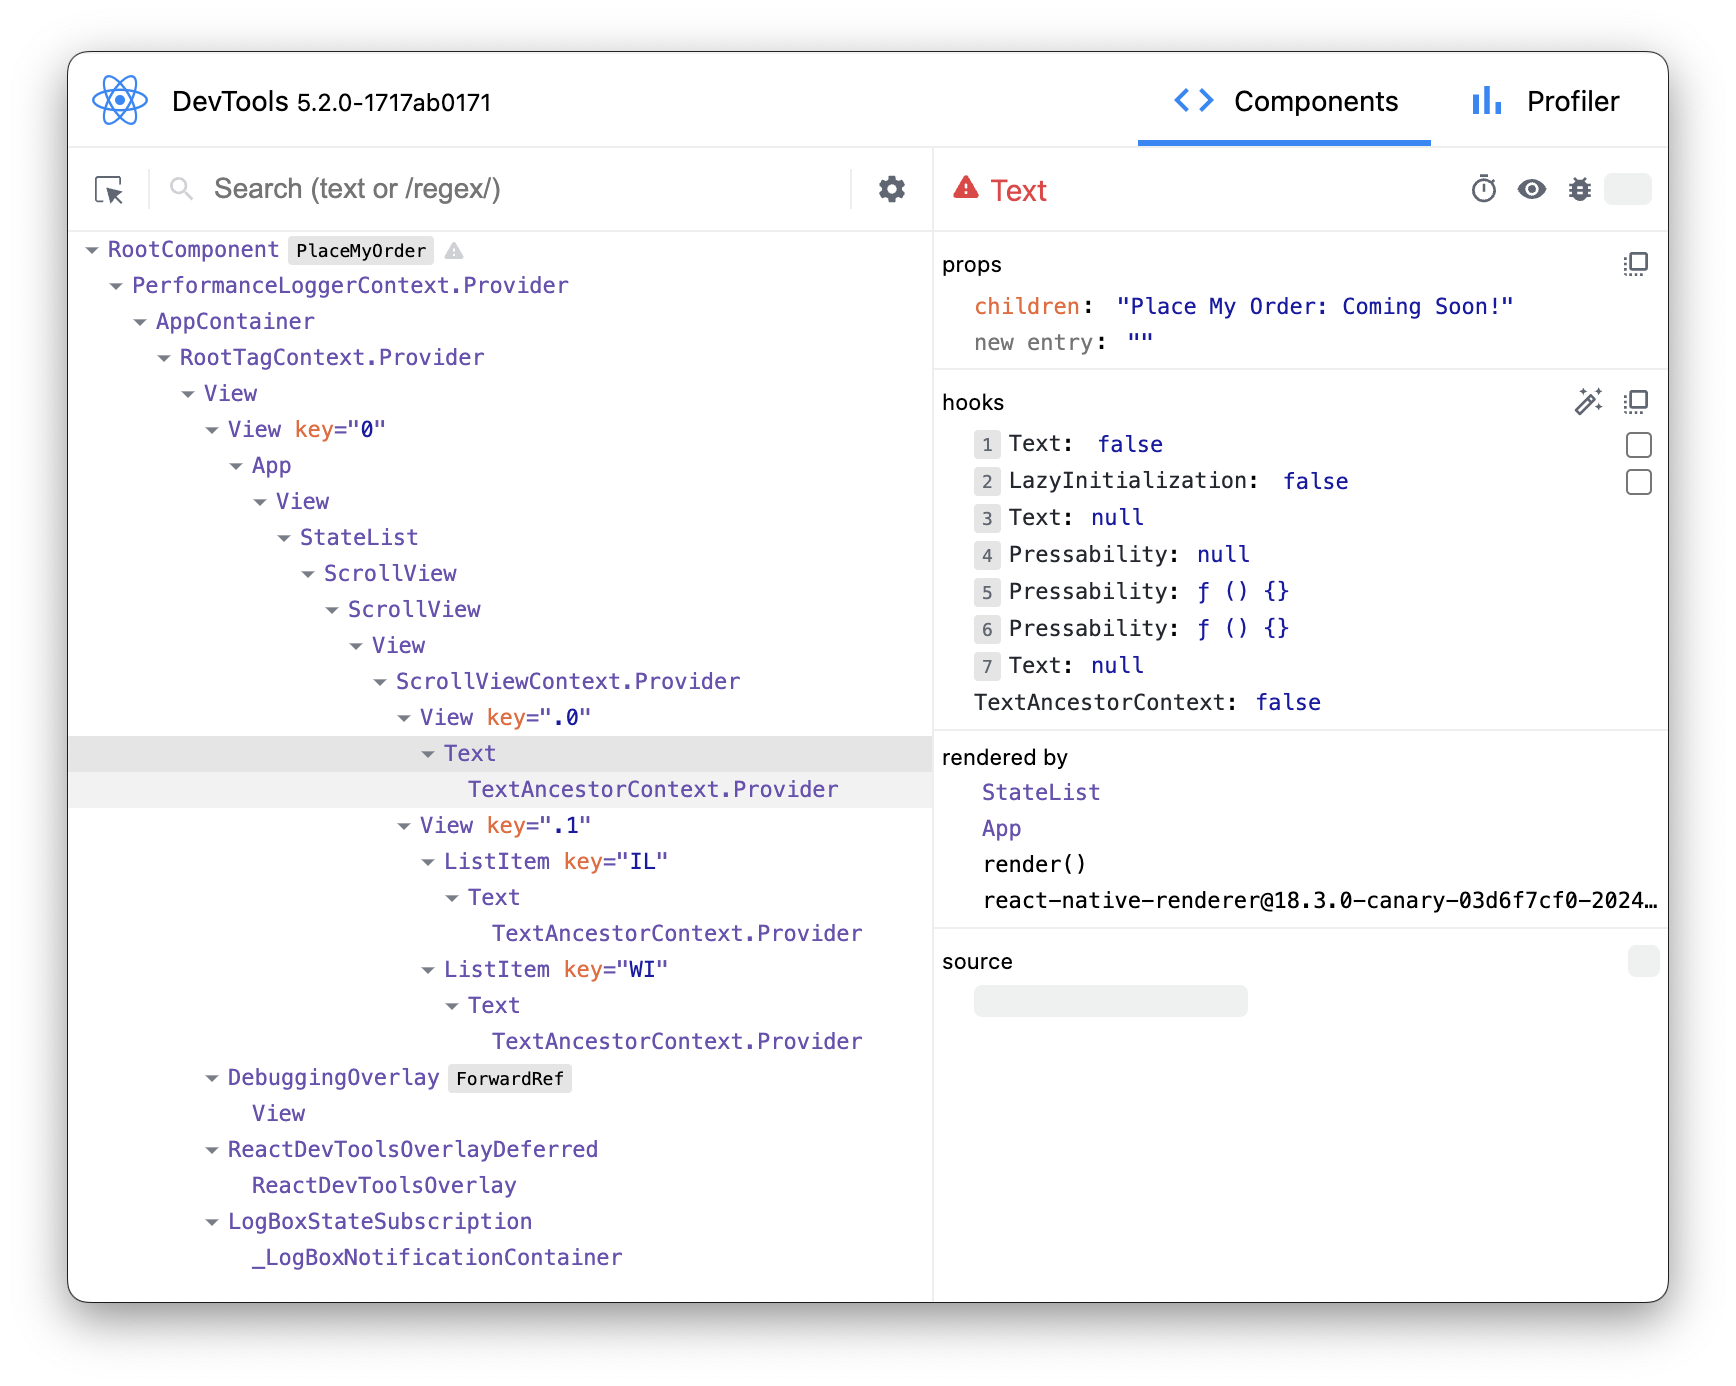
React DevTools is an extension that provides a powerful set of tools for inspecting and debugging React Native applications. It allows developers to inspect and manipulate the hierarchy of React Native components rendered in their mobile applications. With React DevTools, developers can easily identify component structures, inspect props and state, track component updates, and even modify component props in real-time, greatly enhancing the debugging and development process for React Native projects.
By examining the JSX code below, developers can gain insight into how React Native components are structured and composed. Comparing the JSX code with the React DevTools component tree allows developers to visualize how each JSX element corresponds to a component instance in the application, providing a deeper understanding of their React applications and aiding in debugging and optimization efforts.
<App>
  <ScrollView>
    <View>
      <Text>Place My Order: Coming Soon!</Text>
    </View>
    <StateList>
      <View>
        <ListItem>
          <Text>Illinois</Text>
        </ListItem>
        <ListItem>
          <Text>Wisconsin</Text>
        </ListItem>
      </View>
    </StateList>
  </ScrollView>
</App>
Setup 1
✏️ Install the new dev dependency:
npm install --save-dev react-devtools@5
✏️ Update src/package.json to be:
{
  "name": "PlaceMyOrder",
  "version": "0.0.1",
  "private": true,
  "scripts": {
    "android": "react-native run-android",
    "clean": "rm -rf tsconfig.tsbuildinfo coverage android/.gradle android/build android/app/build node_modules/.cache",
    "depcheck": "depcheck .",
    "devtools": "react-devtools",
    "eslint": "eslint .",
    "eslint:fix": "eslint --fix .",
    "ios": "react-native run-ios",
    "lint": "npm run eslint && npm run prettier",
    "lint:fix": "npm run eslint:fix && npm run prettier:fix",
    "precheck": "npm run typecheck && npm run lint && npm run depcheck && npm test",
    "prettier": "prettier --check .",
    "prettier:fix": "prettier --write .",
    "start": "react-native start --reset-cache",
    "test": "jest",
    "test:inspect": "node --inspect-brk ./node_modules/.bin/jest --watch",
    "test:watch": "jest --watch",
    "typecheck": "tsc --noEmit"
  },
  "dependencies": {
    "react": "18.2.0",
    "react-native": "0.74.1"
  },
  "devDependencies": {
    "@babel/core": "^7.20.0",
    "@babel/preset-env": "^7.20.0",
    "@babel/runtime": "^7.20.0",
    "@bitovi/eslint-config": "^1.8.0",
    "@react-native/babel-preset": "0.74.83",
    "@react-native/eslint-config": "0.74.83",
    "@react-native/metro-config": "0.74.83",
    "@react-native/typescript-config": "0.74.83",
    "@testing-library/react-native": "^12.5.0",
    "@types/jest": "^29.5.12",
    "@types/react": "^18.2.6",
    "@types/react-test-renderer": "^18.0.0",
    "babel-jest": "^29.6.3",
    "depcheck": "^1.4.7",
    "eslint": "^8.19.0",
    "jest": "^29.6.3",
    "prettier": "2.8.8",
    "react-devtools": "^5.2.0",
    "react-test-renderer": "18.2.0",
    "typescript": "5.0.4"
  },
  "engines": {
    "node": ">=20"
  }
}
Verify 1
While the application is running execute the command:
✏️ Run:
npm run devtools
This should open a separate window that looks like the following image:
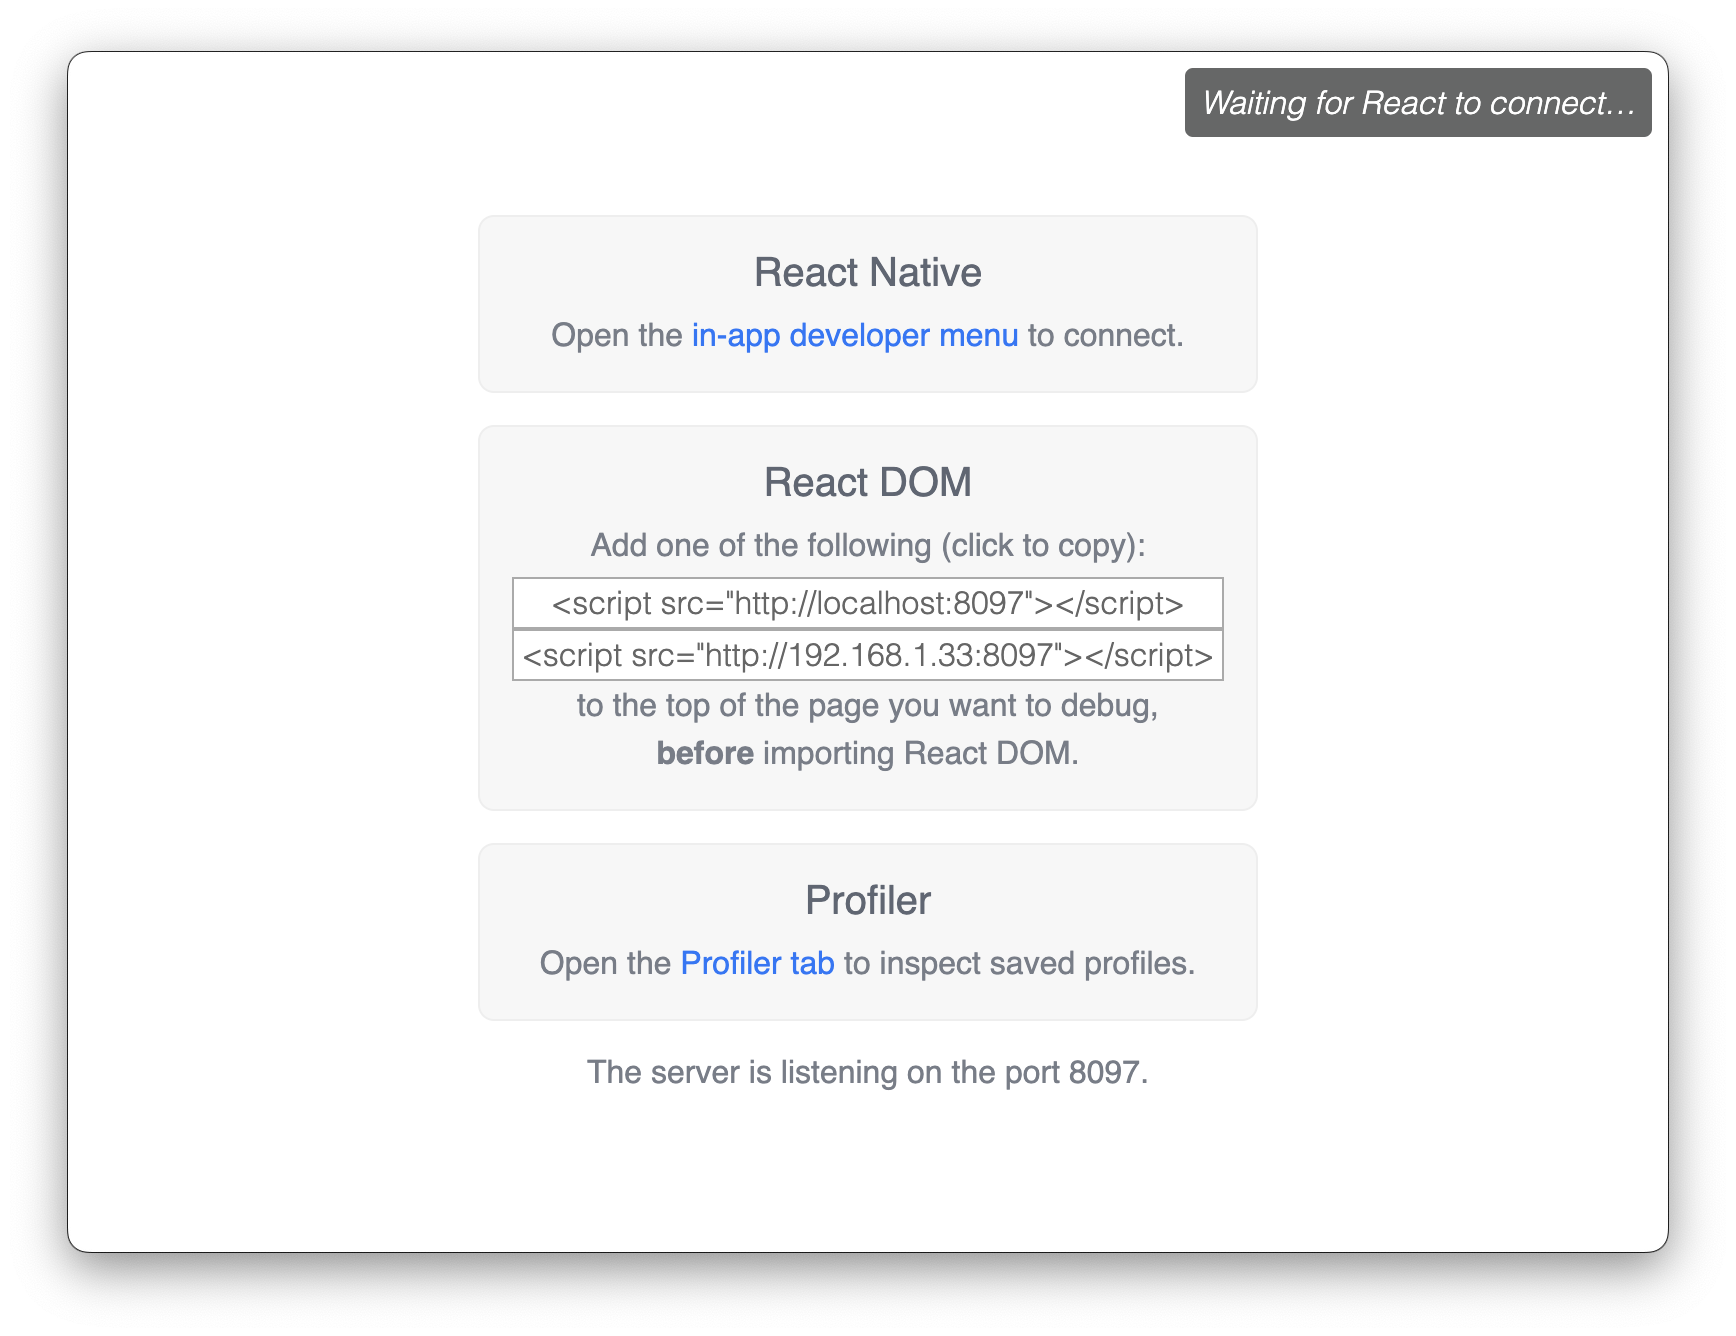
At this point, DevTools is not connected.
To connect DevTools to the application, go back to the terminal where you ran npm run start and press r to reload.
Exercise 1
Explore the “Components” tab:
- Use the "Components" tab to explore the hierarchical structure of the React Native components in the application.
- Expand and collapse component trees to understand the component composition.
- Hover over individual components to highlight them.
Inspect props and state:
- Select a component from the component tree to inspect its props and state.
- View the current props and state values, and observe how they affect the component’s rendering.
Modify props:
- Experiment with modifying props directly from the DevTools panel.
- Change prop values and observe how they affect the component’s appearance or behavior in real-time.
Objective 2: React Native’s debugger
We will be setting up React Native Debugger to help us debug:
Using React Native’s debugger
React Native Debugger, is a feature in React Native that serves as a debugging tool for developers to step through the code, analyze props, and state more efficiently in their React Native applications. React Native Debugger provides valuable insights into the application's state and flow. React Native Debugger will enhance the debugging process for React Native projects, offering essential functionalities for identifying and resolving issues during development.
Setup 2
✏️ Update src/package.json to be:
{
  "name": "PlaceMyOrder",
  "version": "0.0.1",
  "private": true,
  "scripts": {
    "android": "react-native run-android",
    "clean": "rm -rf tsconfig.tsbuildinfo coverage android/.gradle android/build android/app/build node_modules/.cache",
    "depcheck": "depcheck .",
    "devtools": "react-devtools",
    "eslint": "eslint .",
    "eslint:fix": "eslint --fix .",
    "ios": "react-native run-ios",
    "lint": "npm run eslint && npm run prettier",
    "lint:fix": "npm run eslint:fix && npm run prettier:fix",
    "precheck": "npm run typecheck && npm run lint && npm run depcheck && npm test",
    "prettier": "prettier --check .",
    "prettier:fix": "prettier --write .",
    "start": "react-native start --reset-cache --experimental-debugger",
    "test": "jest",
    "test:inspect": "node --inspect-brk ./node_modules/.bin/jest --watch",
    "test:watch": "jest --watch",
    "typecheck": "tsc --noEmit"
  },
  "dependencies": {
    "react": "18.2.0",
    "react-native": "0.74.1"
  },
  "devDependencies": {
    "@babel/core": "^7.20.0",
    "@babel/preset-env": "^7.20.0",
    "@babel/runtime": "^7.20.0",
    "@bitovi/eslint-config": "^1.8.0",
    "@react-native/babel-preset": "0.74.83",
    "@react-native/eslint-config": "0.74.83",
    "@react-native/metro-config": "0.74.83",
    "@react-native/typescript-config": "0.74.83",
    "@testing-library/react-native": "^12.5.0",
    "@types/jest": "^29.5.12",
    "@types/react": "^18.2.6",
    "@types/react-test-renderer": "^18.0.0",
    "babel-jest": "^29.6.3",
    "depcheck": "^1.4.7",
    "eslint": "^8.19.0",
    "jest": "^29.6.3",
    "prettier": "2.8.8",
    "react-devtools": "^5.2.0",
    "react-test-renderer": "18.2.0",
    "typescript": "5.0.4"
  },
  "engines": {
    "node": ">=20"
  }
}
✏️ Update src/screens/StateList/StateList.tsx to be:
import { ScrollView, Text, View } from "react-native"

import ListItem from "./components/ListItem"

const states = [
  {
    name: "Illinois",
    short: "IL",
  },
  {
    name: "Wisconsin",
    short: "WI",
  },
]

const StateList: React.FC = () => {
  console.info("Inside the StateList component.")
  debugger

  return (
    <ScrollView>
      <View>
        <Text>Place My Order: Coming Soon!</Text>
      </View>
      <View>
        {states?.length ? (
          states.map((state) => (
            <ListItem key={state.short} name={state.name} />
          ))
        ) : (
          <Text>No states found</Text>
        )}
      </View>
    </ScrollView>
  )
}

export default StateList
Exercise 2
Execute the command:
✏️ Terminate your existing npm run start process and run:
npm run start
The application should be running in Android Studio.
✏️ In a new command-line interface (CLI) window, run:
adb shell input keyevent 82
This will open up the dev menu. It should look like the following image:
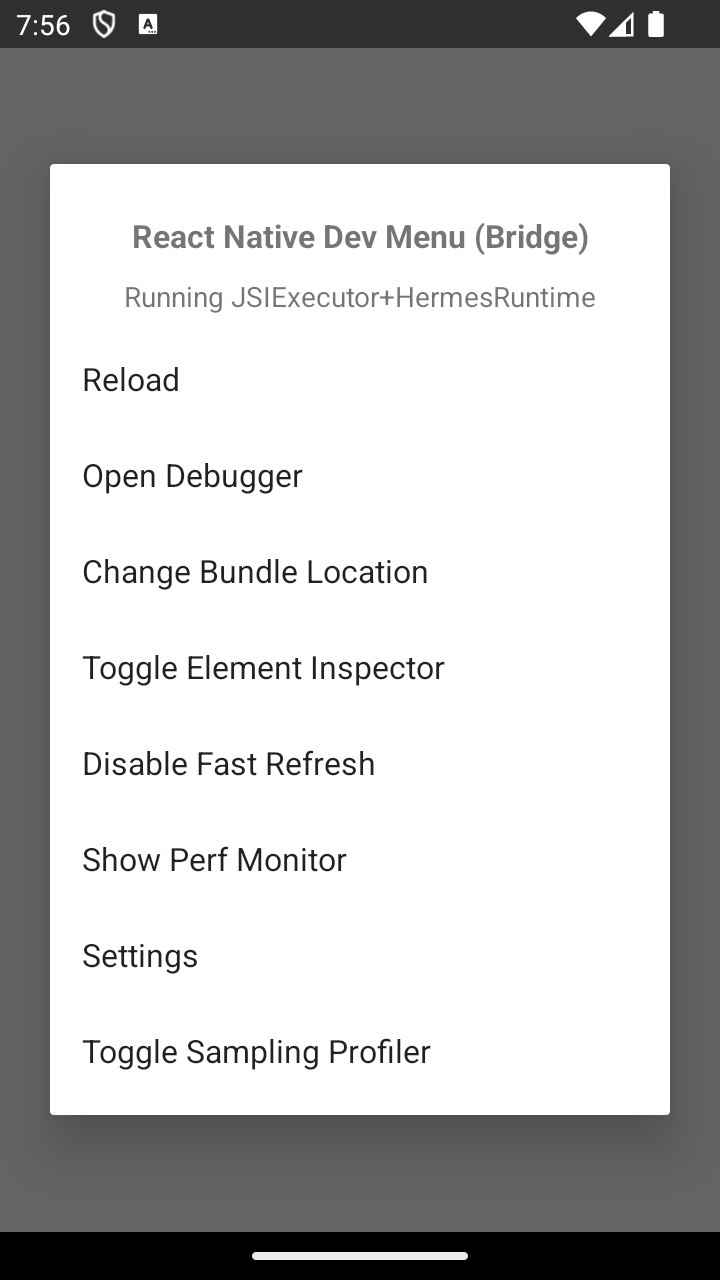
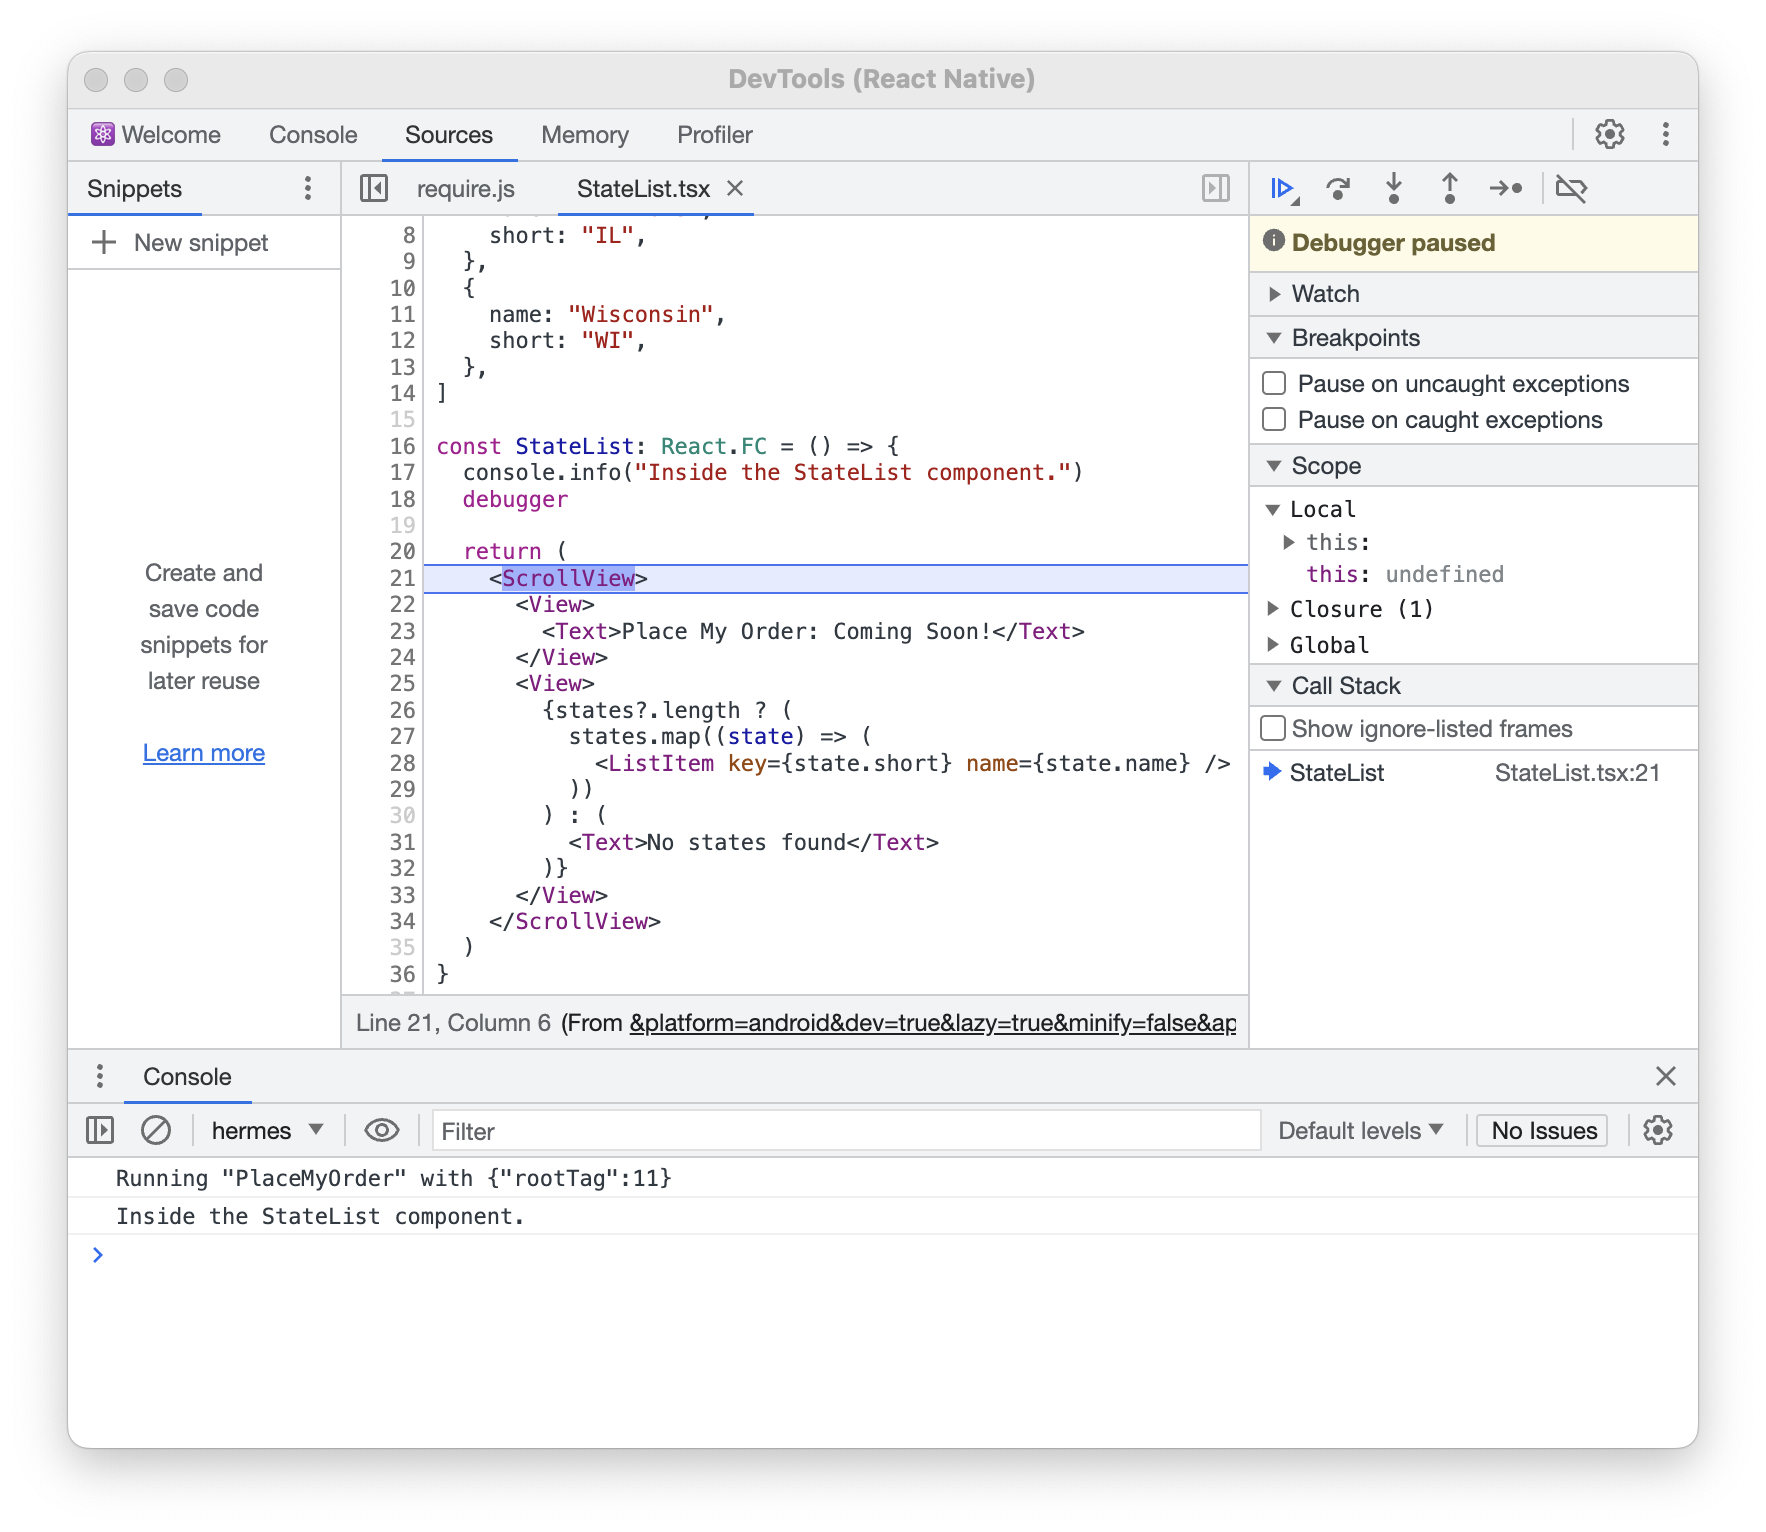
Clicking on "Open Debugger" will open up a separate window for debugging.
To see where the debugger is currently stopped, click on StateList under the “Call Stack” section in the right page of the “Sources” tab.
Exercise 2
Exploring the debugger:
- View where the
console.info("Inside the StateList component.")is being printed. - Step through your code using the debugger controls (step into, step over, step out) to understand its execution flow.
Next steps
Next, let’s learn about different ways to apply Styling in React Native to React Native applications.